

newPM® - Human Insight Enhanced Through Data & AI
Augment and integrate human-centric data with existing project performance data and reporting to shape decision making in real time.
Powered by the MeetingQuality Platform and AI.
The human or people dimension covers the, as yet, untapped data stream that is either not considered, used in a limited way or the value understood.
Through advances in data analytics and the now easy availability of AI tools there is an opportunity to mine this stream of “dark matter” data.
This can provide project team members, leaders and sponsors insights to aide their decision making and therefore improve project delivery and, critically, productivity.
People will be able to achieve more from less effort through greater insight, improved relationships, risk perception, success perception and a multitude of other information.
The intention is to use the feelings and perceptions of people that are often strong “lead indicators” for variance and risk around key “hard” project performance metrics such as budget, schedule, benefits.
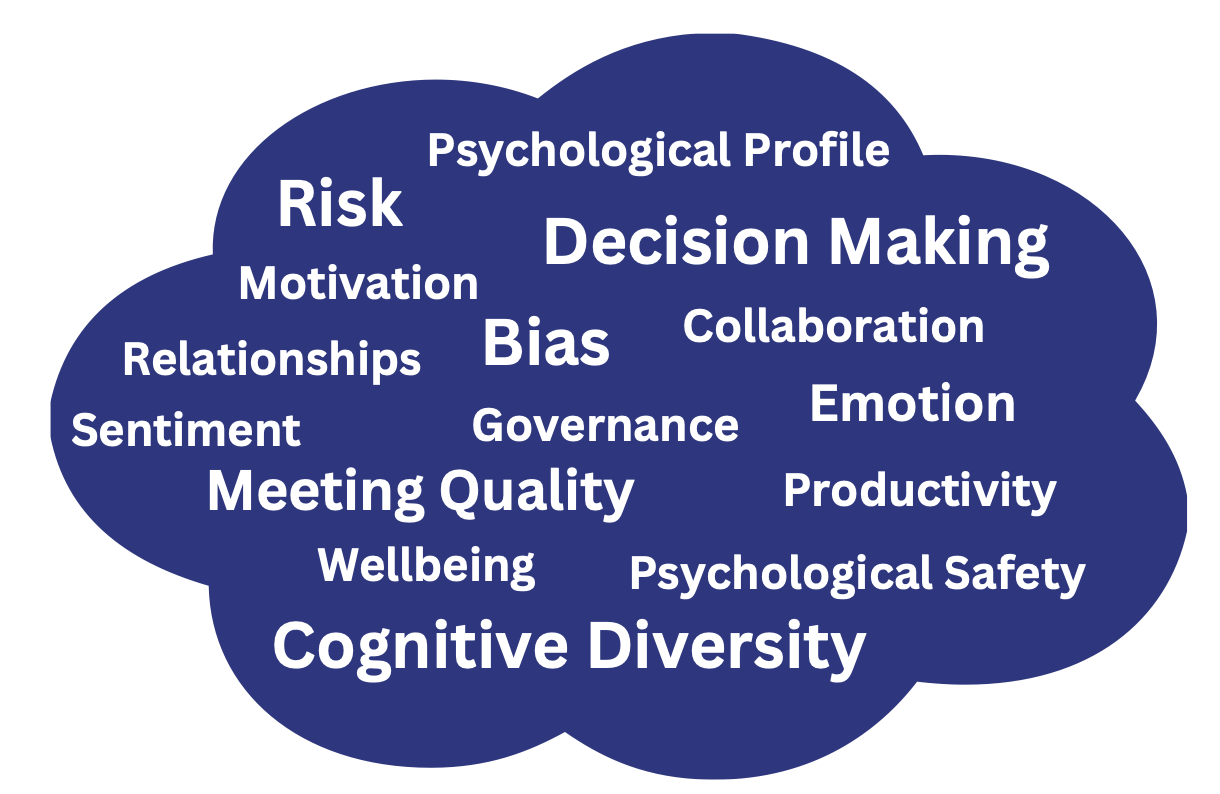
There are multiple use cases that will benefit from the use of human centred data that can improve how we:
A - collaborate at the relationship, team dynamics or organisational culture level
B - take into account the diversity of thinking and approaches (again at an individual, team or cultural level) to improve our structures and processes
C – predict the impact that aspects such as bias and self-interest as well as the 2 previous points have on the decisions made around how we define success.
Ultimate aiming to predict and allow you to stimulate and test outcomes on projects.
These metrics differ considerably from existing hard project data. Most existing project data is following or output data.
These new Human Insights are leading indicators. Produced in near real-time, they can show exactly what the project team is thinking at moments in time.
This allows for trend data to be collected and acted on, long before the likes of schedule variance, budget variance or risk data materialises in the hard metrics.
Emotive Representation


As well as traditional dashboard graphics, the information provided by team members can be assessed using AI to produce emotive representations.
Why is this important? Not all team members like numerical data and our research shows that the emotive representations can appeal much more to team members in capturing exactly how they perceive project progress, success and productivity.
Want to know more?
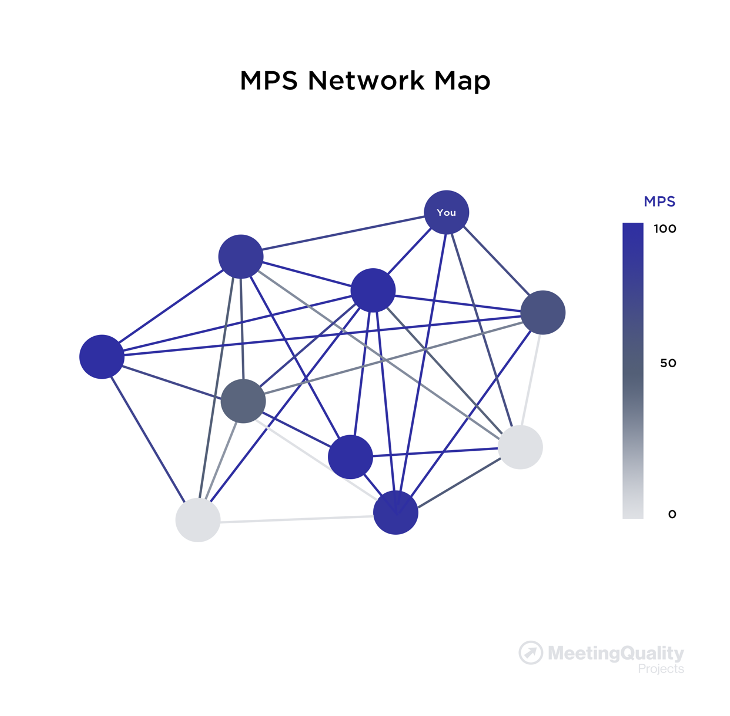
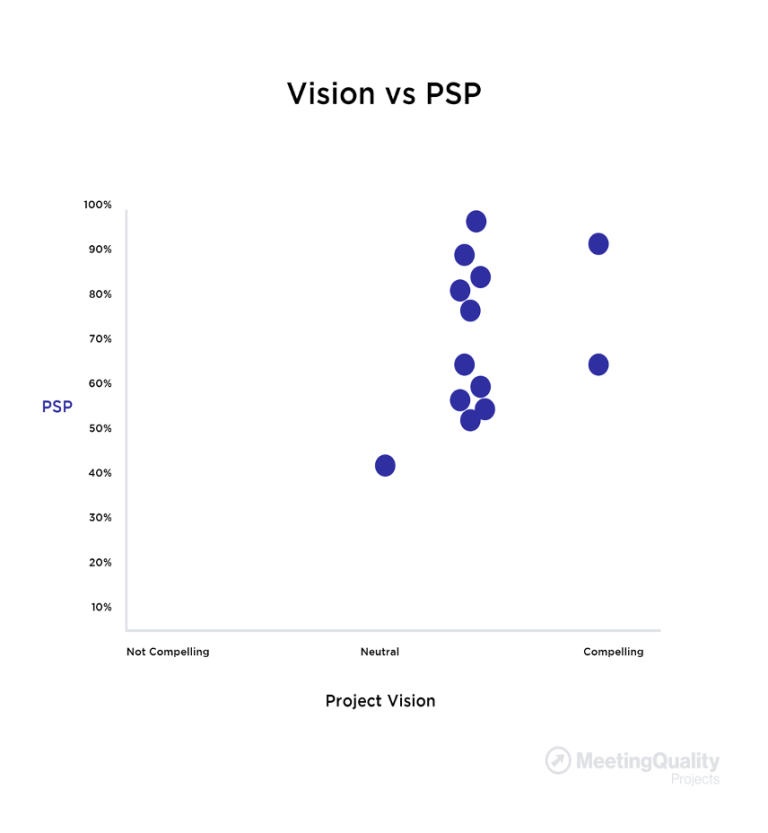
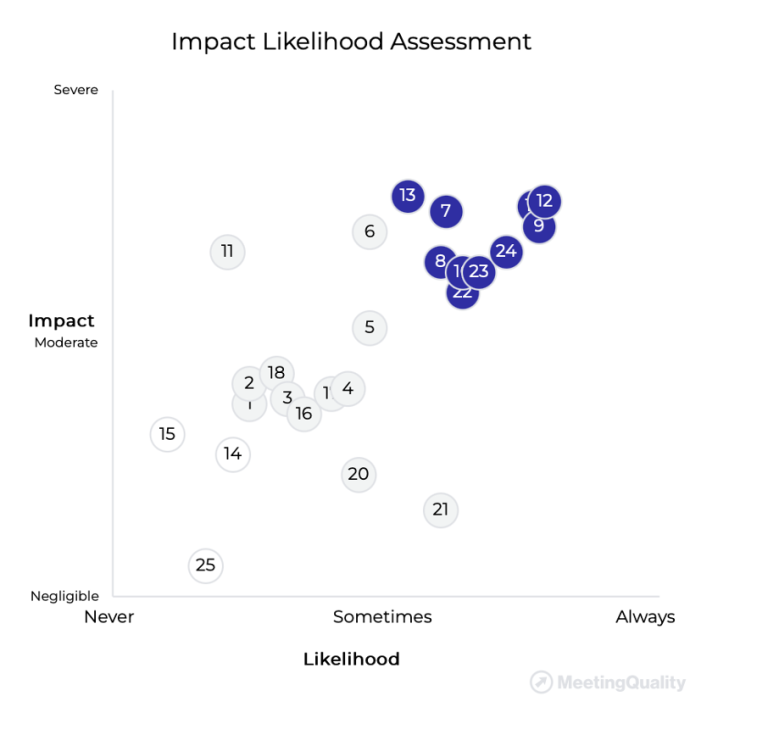
Example Dashboard Data


© Copyright. All rights reserved.
We need your consent to load the translations
We use a third-party service to translate the website content that may collect data about your activity. Please review the details in the privacy policy and accept the service to view the translations.